
How is the Unemployment Rate Measured?
How do you feel about the current unemployment rate?
This content leverages data from USAFacts, a non-profit that visualizes governmental data. You can learn more on its website, Facebook, and Twitter.
America’s unemployment rate returned to a 50-year low of 3.5% in November after the economy added 266,000 jobs and the strikes by auto workers that caused a slight uptick in October were resolved. To help eliminate some of the confusion around the various unemployment-related metrics tracked by the federal government, we’ll break down the number and how they’re reached below.
What is the unemployment rate?
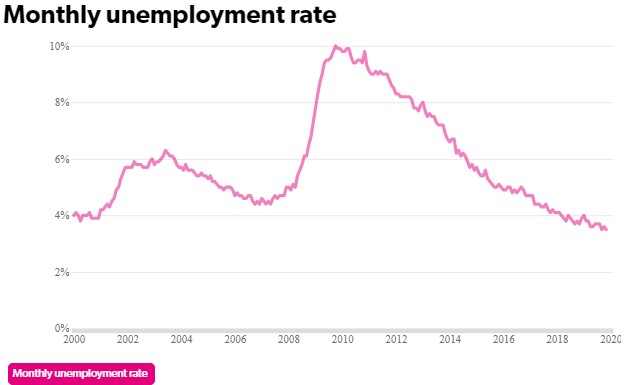
There are several different unemployment rates used by the Bureau of Labor Statistics (BLS) to offer insights into the state of the U.S. labor force, but the official unemployment rate that is most commonly reported is known as the U-3 unemployment rate. It’s calculated by taking the total number of unemployed people who are actively looking for work and dividing that number by the total civilian labor force, then multiplying it by 100 to make it a percentage.
This chart from USAFacts shows the monthly U-3 unemployment rate since 2000, which was above 9% from April 2009 to September 2011 and peaked at 10% in October 2009, but has been below 4% since January 2019:
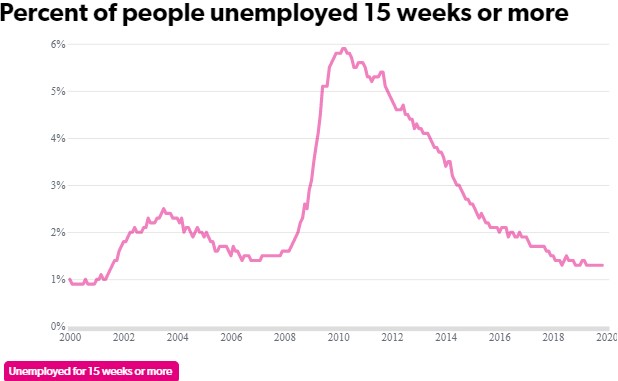
The BLS also tracks the number of people who have been unemployed for 15 weeks or more with its U-1 unemployment rate. As the chart below shows, the U-1 unemployment rate peaked at 5.9% in April 2010 but has remained below 2% since October 2016:
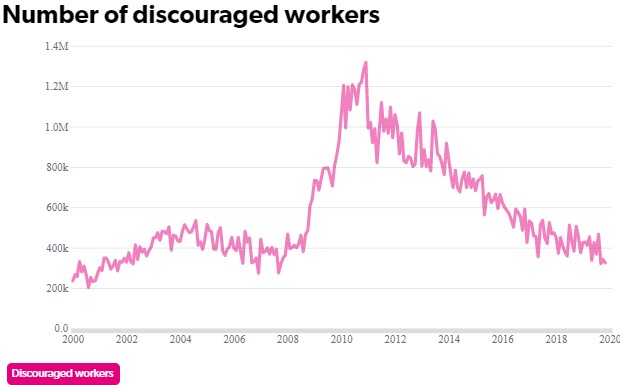
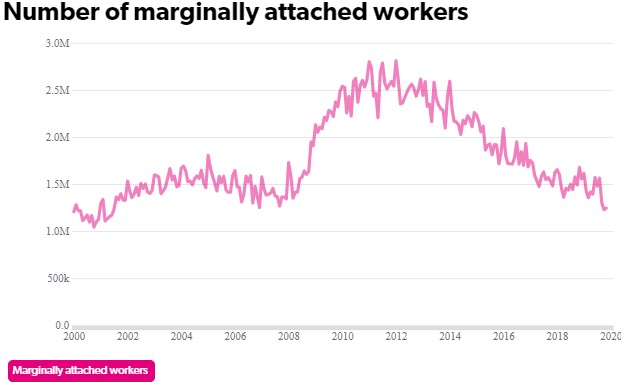
The BLS measures the number of “discouraged workers” in the labor force who have given up on job searching, who are added to the U-3 unemployment in the U-4 unemployment rate. BLS also tracks the number “marginally attached workers” who were available to work and looked for a job in the prior 12 months, but not in the last four weeks, in the U-5 unemployment rate by adding them to the U-3 unemployment rate. In November 2019, there were 325,000 discouraged workers ― the lowest total since October 2007 ― and 1,246,000 marginally attached workers, which is the lowest total since July 2001:
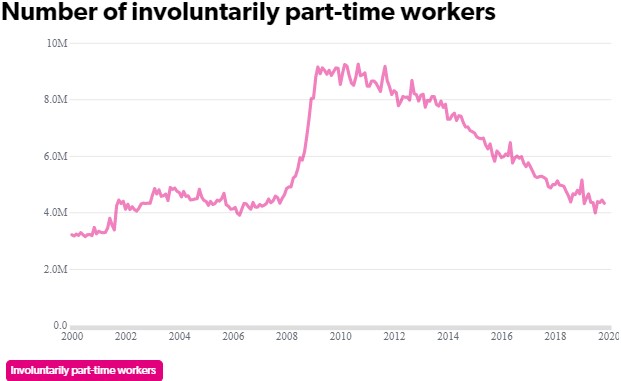
Additionally, the BLS monitors the number of “underemployed” workers who are working part-time involuntarily, because either their hours were reduced or because part-time work is all they could find. In November 2019, there were 4,322,000 involuntarily part-time workers, a level that’s about on par with the monthly average throughout the year and the lowest the figure has been at since 2007:
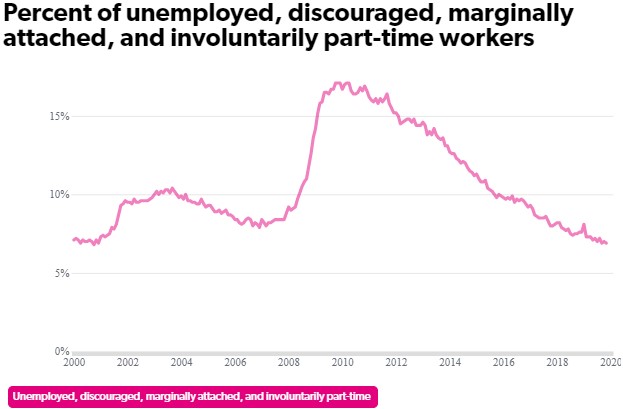
The BLS combines the unemployed, discouraged, marginally attached, and involuntarily part-time workers in the U-6 unemployment rate. In November 2019 the U-6 unemployment rate was 6.9% ― the lowest it has been since it hit 6.8% in October 2000:
— Eric Revell
(Photo Credit: iStock.com / skynesher)
The Latest
-
 IT: Here's how you can help fight for justice in the U.S., and... 📱 Are you concerned about your tech listening to you?Welcome to Thursday, April 18th, communities... Despite being deep into the 21st century, inequity and injustice burden the U.S. read more...
 -
 Restore Freedom and Fight for Justice With GravvyDespite being deep into the 21st century, inequity and injustice burden the U.S., manifesting itself in a multitude of ways. read more... Criminal Justice Reform
 -
 Myth or Reality: Is Our Tech Listening?What's the story? As technology has become more advanced, accessible, and personalized, many have noticed increasingly targeted read more... Artificial Intelligence
 -
 IT: 🧊 Scientists say Antarctic ice melt is inevitable, and... Do you think Trump is guilty?Welcome to Tuesday, April 16th, members... Scientists say Antarctic ice melt is inevitable, implying "dire" climate change read more...
 Climate & Consumption
 Health & Hunger
 Politics & Policy
 Safety & Security
