
What Are the Best & Worst Airports for Flight Delays?
How do you feel about flight delays?
This content leverages data from USAFacts, a non-profit that visualizes governmental data. You can learn more on its website, Facebook, and Twitter.
The holiday season that stretches from Thanksgiving to New Year’s Day is one of the busiest times of the year for air travel. With winter weather throwing a wrench into travelers’ plans across much of the country, here’s a look at what airports fare the best and worst in terms of flight delays ― which are defined by the Dept. of Transportation as flights that are at least 15 minutes late.
Where are delays the longest & most common?
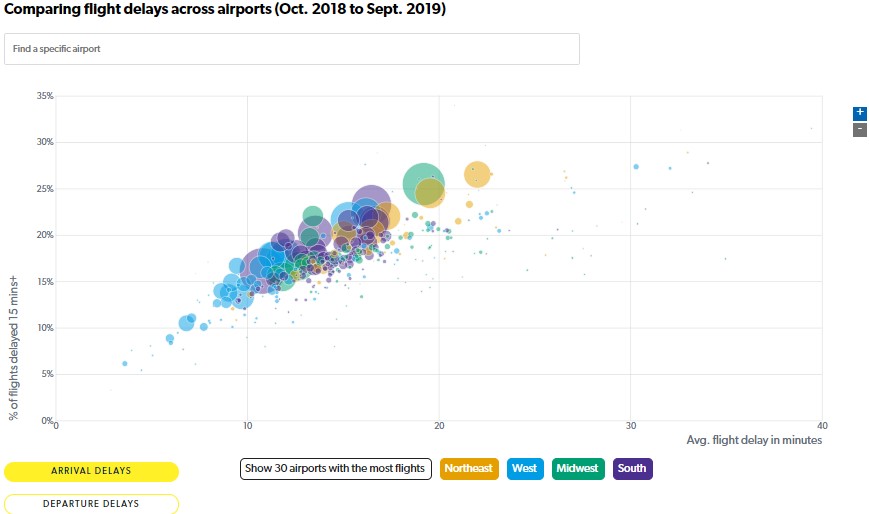
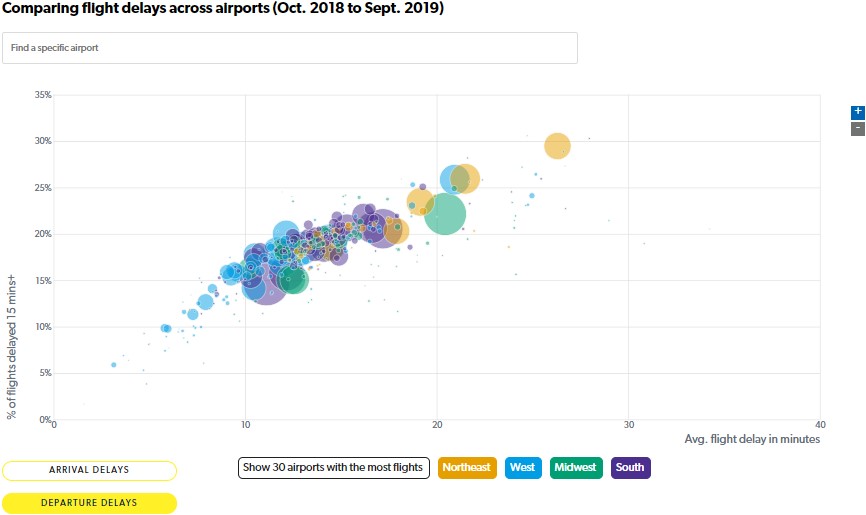
The following charts from USAFacts compare the frequency of delayed arrival & departure flights, respectively, at airports across the country. The airports are color-coded by region, and the size of the circle indicates the relative duration of delays. The data shows that flight delays are more common and longer at Northeastern airports, whereas airports in the West have shorter & less frequent delays. (You can also search for a specific airport served by commercial airline(s) here.)
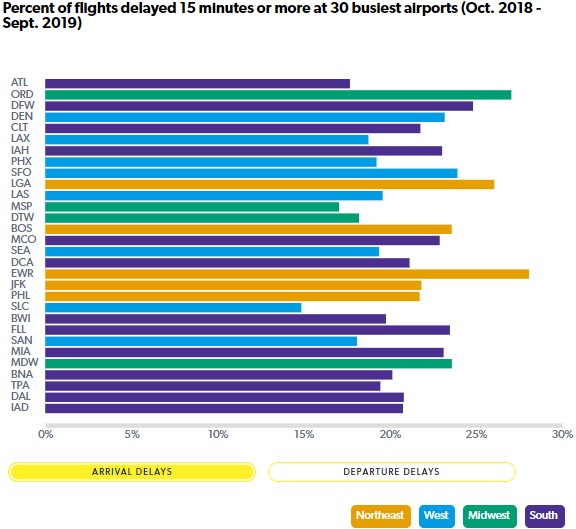
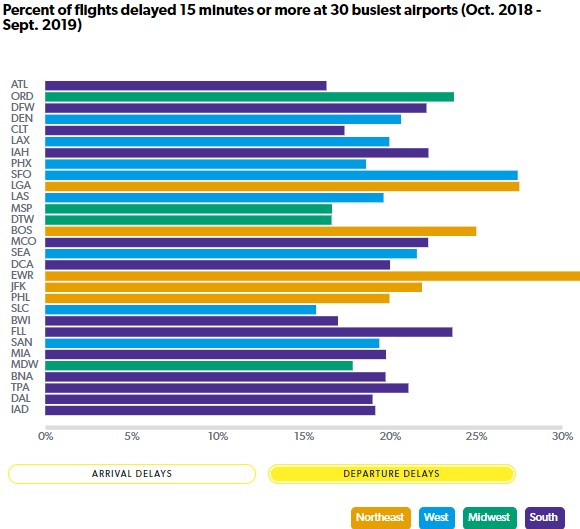
These next two charts show the frequency of delayed arrival & departure flights, respectively, at America’s 30 busiest airports. Arriving flights fared the worst at Newark Liberty International (26.5% delayed), followed by Chicago O’Hare International (25.5%), and LaGuardia in New York (24.5%). Departures also fared the worst at Newark (29.5% delayed), followed by LaGuardia (25.9%) and San Francisco International (25.8%).
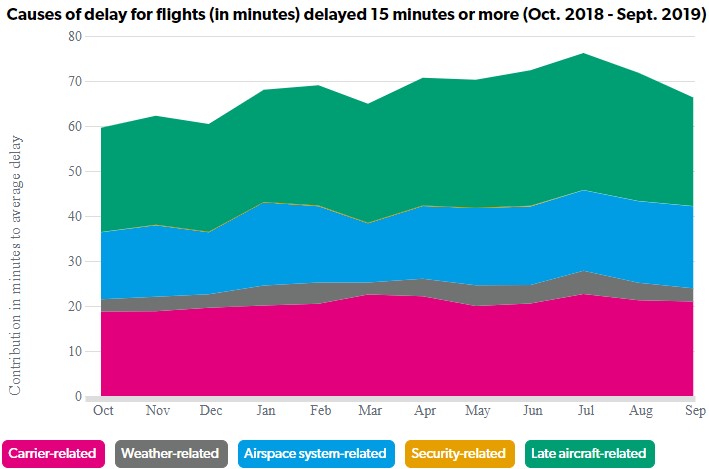
What causes flight delays?
As this chart from USAFacts shows, flight delays caused by late-arriving aircraft, carrier-related issues (like cleaning or refueling aircraft or loading baggage), and air traffic contribute the most to delays throughout the year. Weather-related delays are present throughout the year (this data excludes cancellations or diverted flights), while security-related delays are thankfully relatively rare.
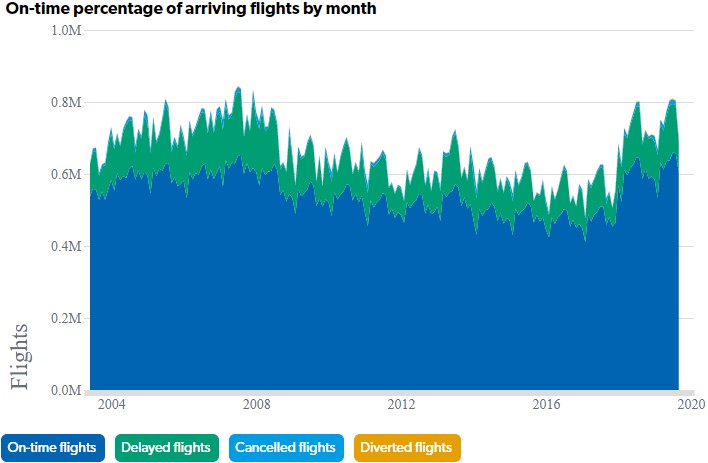
This USAFacts chart shows the number of flights each month that arrive on time, are delayed, cancelled, or diverted. For the first nine months of 2019, 82.2% of the nearly seven million flights in the U.S. were on time.
— Eric Revell
(Photo Credit: iStock.com / Yelizaveta Tomashevska)
The Latest
-
 IT: Here's how you can help fight for justice in the U.S., and... 📱 Are you concerned about your tech listening to you?Welcome to Thursday, April 18th, communities... Despite being deep into the 21st century, inequity and injustice burden the U.S. read more...
 -
 Restore Freedom and Fight for Justice With GravvyDespite being deep into the 21st century, inequity and injustice burden the U.S., manifesting itself in a multitude of ways. read more... Criminal Justice Reform
 -
 Myth or Reality: Is Our Tech Listening?What's the story? As technology has become more advanced, accessible, and personalized, many have noticed increasingly targeted read more... Artificial Intelligence
 -
 IT: 🧊 Scientists say Antarctic ice melt is inevitable, and... Do you think Trump is guilty?Welcome to Tuesday, April 16th, members... Scientists say Antarctic ice melt is inevitable, implying "dire" climate change read more...
 Climate & Consumption
 Health & Hunger
 Politics & Policy
 Safety & Security
